
!pip install pyspark
from pyspark import SparkContext, SparkConf
from pyspark.sql import SparkSession, SQLContext

sc = SparkContext('local', 'ml-studio')
sc
sqlContext = SQLContext(sc)
sqlContext
Outlier Detection: An ETL Tutorial with Spark
Part of the Industry 4.0 framework is to make sure that manufacturers have more visibility over what’s going on with their machines in the factory floors. This is why Industry 4.0 works tightly with Internet of Things. IoT allows large scale real-time data collection from sensors that are installed in production equipment possible. Nevertheless, having good Data Collection Agents alone isn’t sufficient. We need an automated way of extracting, analyzing and summarizing information from the large data stream, since it’s impossible for humans to do it manually. In big data terminology, this process is often referred to as ETL (Extract-Transform-Load).
Today, we’ll discuss one family of algorithm that I have personally seen to be useful in the industry: outlier detection. The idea is to find any abnormal measurements from the data stream and highlight them to the domain experts e.g. process engineers. I will share an implementation of a basic anomaly detection algorithm in Spark. I could have done the same tutorial with python’s pandas-dataframe, but unfortunately once we deal with big dataset (whose size is way larger than memory space), the latter is no longer suitable.
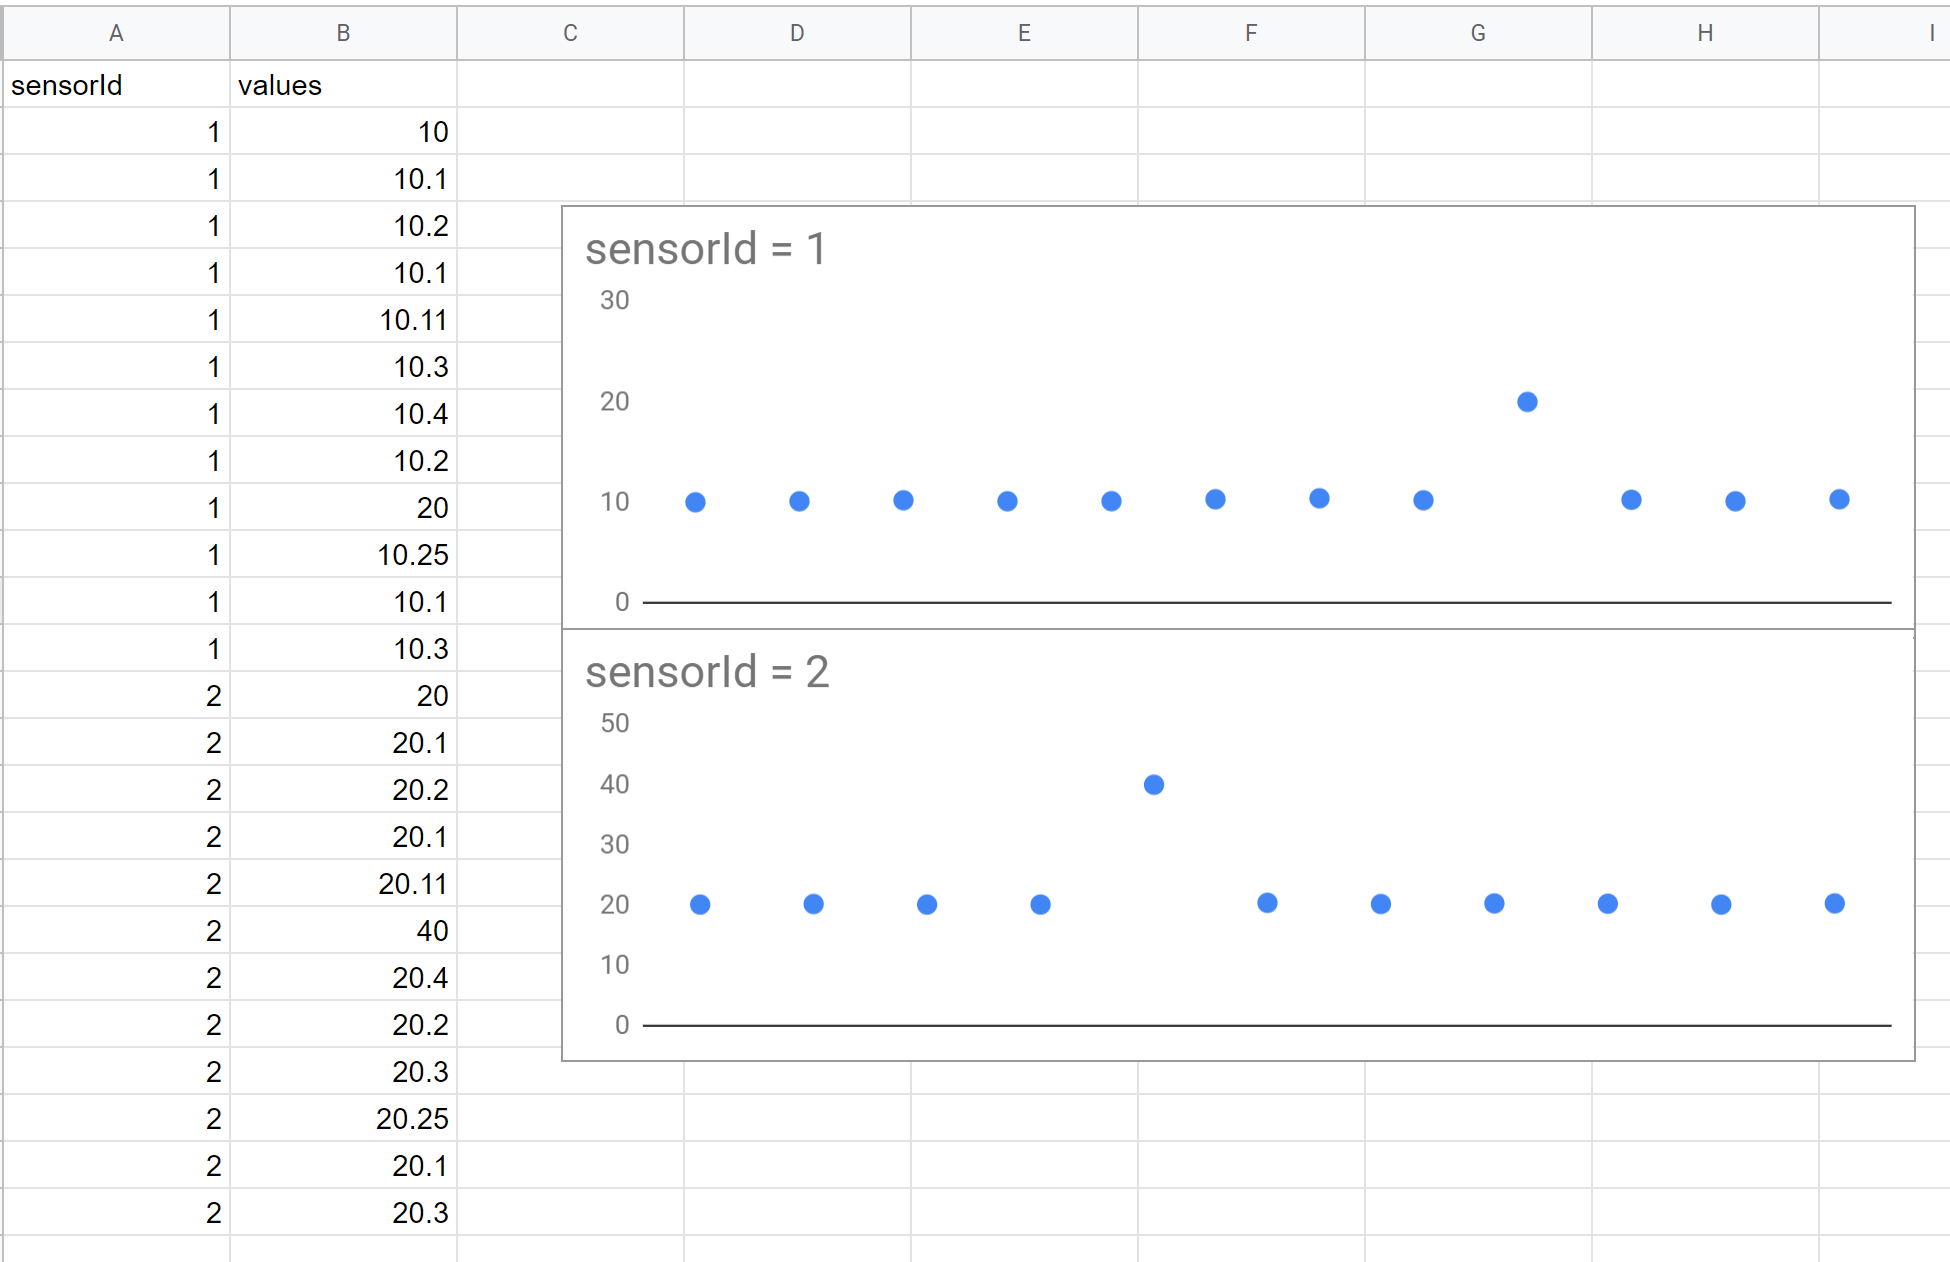
This is a simple dummy dataset that I use. Suppose we have data stream from 2 sensors. How can we automatically capture the two anomalous dots that are present below?
Outlier Detection
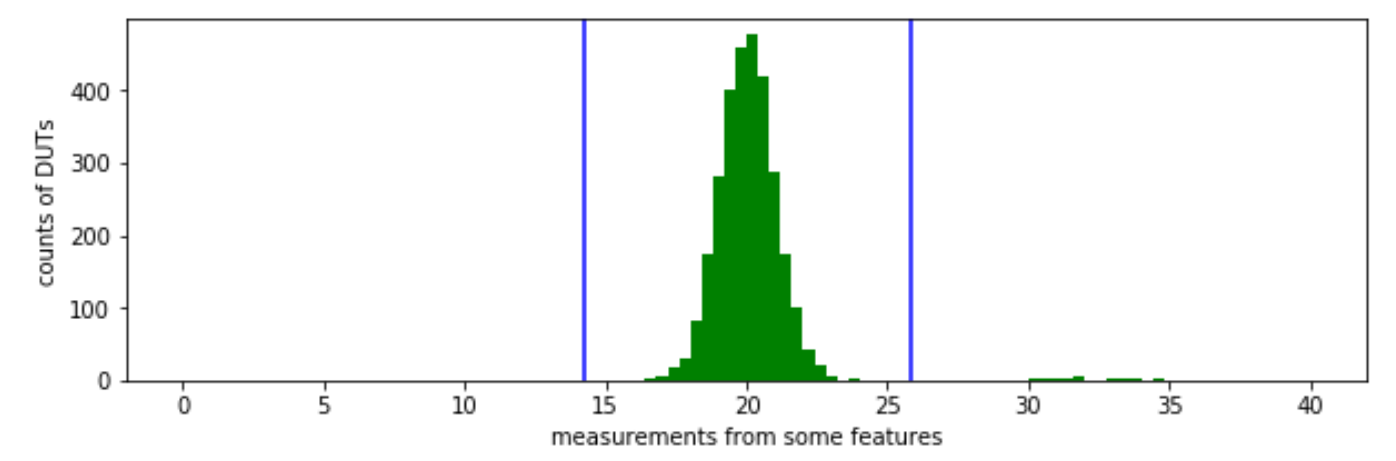
The model that we use finds region of values whose probability of occurrence are low under the distribution that has been fitted to the observed data. We assume that our sensors are unimodal gaussian in nature. With that, we can calculate the two thresholds that are six sigma away from the distribution’s mean.

Visually, the thresholds are fitted in this manner. Any measurements above the Upper Limit (around 25) or below the Lower Limit (around 15) are deemed as outliers.
Now to implement this in Spark, we first import all of the library dependencies:
from pyspark.sql import *
from pyspark.sql.types import *
from pyspark.sql.functions import *
Extract
We now assume that our data comes in a csv format. It has also been saved in a file called test.csv. We first specify the data schema explicitly. Note than in production, data could also be obtained from a database and message broker (e.g. MQTT, Kafka etc…).
customSchema = StructType([
    StructField("sensorId", StringType(), True),
    StructField("values", DoubleType(), True)])
Then, we read the csv file into a Spark DataFrame. Here we can see that there are only two columns: sensorId and values.
# load dataset
df = sqlContext.read.format("csv").option("header", "true").schema(customSchema).load("data/test.csv")

df.printSchema()
We can register the dataset as a table for SQL-style queries:
df.createOrReplaceTempView("sensors")
sqlContext.sql("SELECT * FROM sensors").show()
Transform
We would like to calculate the distribution profile for each sensorID, particularly the Upper and Lower Outlier Thresholds. To do that, we need to group the dataframe by sensorId, followed by aggregating each sensor data’s mean and standard deviation accordingly. We can then create 2 new columns, one for each outlier threshold.
# calculate statistics
statsDF = df.groupBy("sensorId").agg(mean(df.values).alias("mean"), stddev(df.values).alias("stddev"))

# add columns with upper and lower limits
statsDF = statsDF.withColumn("UpperLimit", statsDF.mean + statsDF.stddev * 3).withColumn("LowerLimit", statsDF.mean - statsDF.stddev * 3)

statsDF.printSchema()
We would now like to find which sensor readings are anomalous in the original dataframe. Since the information live in two different dataframes, we need to join them using the sensorId column as a common index.
# join the two dataframe
joinDF = df.join(statsDF, df.sensorId == statsDF.sensorId)
Lastly, we can filter rows whose values lie beyond the range enclosed by the outlier thresholds. Voila! We managed to capture the two anomalous points.
# outlierDetection
def detect_outlier(values, UpperLimit, LowerLimit):
    # outliers are points lying below LowerLimit or above upperLimit
    return (values < LowerLimit) or (values > UpperLimit)

udf_detect_outlier = udf(lambda values, UpperLimit, LowerLimit: detect_outlier(values, UpperLimit, LowerLimit), BooleanType())

outlierDF = joinDF.withColumn("isOutlier", udf_detect_outlier(joinDF.values, joinDF.UpperLimit, joinDF.LowerLimit)).filter("isOutlier")

outlierDF.createOrReplaceTempView("outliers")
sqlContext.sql("SELECT * FROM outliers").show()
Conclusion
We have seen how a typical ETL pipeline with Spark works, using anomaly detection as the main transformation process. Note that some of the procedures used here is not suitable for production. For example, CSV input and output are not encouraged. Normally we would use Hadoop Distributed File System (HDFS) instead. The latter could be wrapped under a database too e.g. HBase. Nonetheless, the main programming paradigm stays the same.