
Student Handout — OLAP Ludic Exercise + Snowflake DW
Context
This hands-on exercise bridges the tangible and the analytical dimensions of OLAP learning. Students begin by building and manipulating a physical cube using moulding paste to represent three analytical dimensions — Product, Region, and Time — exploring how slicing, dicing, roll-ups, and drill-downs modify the cube. This tactile step supports conceptual understanding of multidimensional aggregation before transitioning to the digital environment.
In the second part, students instantiate the same cube virtually by creating and populating a snowflake data warehouse schema in PostgreSQL. They then run advanced SQL queries (GROUPING SETS, ROLLUP, CUBE, and window functions) to compute summaries, growth indicators, and category shares.
Learning Objective: Practice advanced SQL aggregation and analytics techniques (GROUPING SETS, ROLLUP, CUBE, and window functions) on a dimensional model.
Material
- Modelling paste
- Spatula
Part I: Build an OLAP Cube with moulding paste (Product × Region × Time). Then map each physical operation to an SQL statement
- Consider the DW setting draw the snowflake schema of the proposed DW.
- Using the modelling paste sticks of different colours, model the smallest cube that can be materialised of the snowflake schema and using the data used in the DW setting.
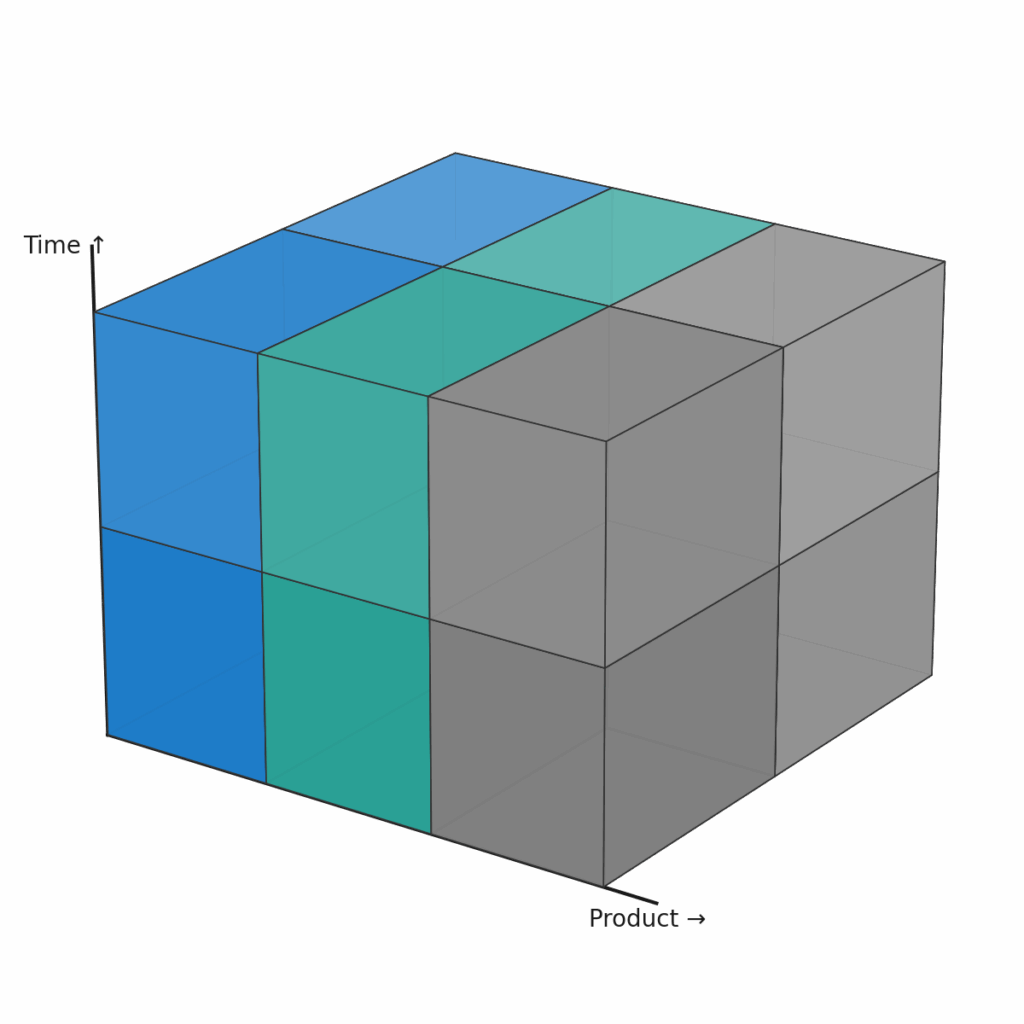
Figure 1. OLAP Cube representing Product × Region × Time dimensions and aggregation operations (slice, dice, drill-down, roll-up).
Part II — Snowflake DW: Build, Populate, Query
- Use the schema diagram and the provided DDL to create dimension tables and the fact table. Populate with the sample inserts and run the OLAP queries. Take a photo
- Using your initial cube and the remaining modelling paste, illustrate the results of applying OLAP operators to the cube. For every result, take a photo.
OLAP Queries to Try
Setting up a querying environment
There are two alternatives to have access to externalized PostgreSQL SQL environments with no installation burden required:
- Aurora PostgreSQL or Aurora MySQL (version ≥8) https://sqliteonline.com
- Create an account (attention! limited number of queries allowed! so avoid testing too much).
- Choose the PostgreSQL option.
- DW setting in PostgreSQL available here: https://drive.google.com/file/d/1Togs0mZytWXhtvmvCMjDJ1rue7ttiTZD/view?usp=sharing
- The SQL queries to test script is available here: https://drive.google.com/file/d/1FxAvalT0rLNtrOt1aTthMPVTEqVWYKEd/view?usp=sharing
2. PostgreSQL externalized cloud (recommended)
- Create a free trial account on the PostgreSQL cloud https://aiven.io
- Create a PostgreSQL instance
- Access from Python
- Open in Colab the following GIST: https://gist.github.com/gevargas/17cebe04b147553df81abd4931eee944
- Use the connection information provided by your Aiven instance to connect from the notebook.
Analyse and test the following query expressions
Q1 – Multilevel Summary with GROUPING SETS
This query calculates total sales revenue at different aggregation levels: by Year + Quarter + Region, by Year + Region, and by Year only. GROUPING SETS lets you produce all these summaries in one query instead of running several GROUP BYstatements.
SELECT
dt.year,
dt.quarter,
dr.region_name,
SUM(fs.revenue) AS revenue
FROM fact_sales fs
JOIN dim_time dt ON fs.time_id = dt.time_id
JOIN dim_region dr ON fs.region_id = dr.region_id
GROUP BY GROUPING SETS (
(dt.year, dt.quarter, dr.region_name),
(dt.year, dr.region_name),
(dt.year)
)
ORDER BY dt.year, dt.quarter NULLS LAST, dr.region_name NULLS LAST;
Q2 – Hierarchical Rollup by Quarter and Category
This query computes total revenue for each quarter and category, including subtotals per quarter and a grand total. The ROLLUP operator automatically adds ‘All categories’ and ‘All quarters’ rows.
SELECT
dt.quarter,
dc.category_name,
SUM(fs.revenue) AS revenue
FROM fact_sales fs
JOIN dim_time dt ON fs.time_id = dt.time_id
JOIN dim_product dp ON fs.product_id = dp.product_id
JOIN dim_subcategory ds ON dp.subcategory_id = ds.subcategory_id
JOIN dim_category dc ON ds.category_id = dc.category_id
GROUP BY ROLLUP (dt.quarter, dc.category_name)
ORDER BY dt.quarter NULLS LAST, dc.category_name NULLS LAST;
Q3 – Two-Dimensional Cube of Region × Channel
This builds a cross-tab combining regions and sales channels. The CUBE operator creates totals per region, totals per channel, and a global total.
SELECT
dr.region_name,
ch.channel_name,
SUM(fs.revenue) AS revenue
FROM fact_sales fs
JOIN dim_region dr ON fs.region_id = dr.region_id
JOIN dim_channel ch ON fs.channel_id = ch.channel_id
GROUP BY CUBE (dr.region_name, ch.channel_name)
ORDER BY dr.region_name NULLS LAST, ch.channel_name NULLS LAST;
Q4 – Top-3 Products per Region and Quarter
Using window functions, this query ranks products by total revenue within each region and quarter. DENSE_RANK() assigns ranks, and we filter to keep only the top three per group.
WITH revenue_p AS (
SELECT dr.region_name, dt.year, dt.quarter, dp.name AS product_name,
SUM(fs.revenue) AS revenue
FROM fact_sales fs
JOIN dim_region dr ON fs.region_id = dr.region_id
JOIN dim_time dt ON fs.time_id = dt.time_id
JOIN dim_product dp ON fs.product_id = dp.product_id
GROUP BY dr.region_name, dt.year, dt.quarter, dp.name
),
ranked AS (
SELECT *, DENSE_RANK() OVER (PARTITION BY region_name, year, quarter ORDER BY revenue DESC) AS rnk
FROM revenue_p
)
SELECT region_name, year, quarter, product_name, revenue, rnk
FROM ranked
WHERE rnk <= 3
ORDER BY region_name, year, quarter, rnk;
Q5 – Quarter-over-Quarter (QoQ) Growth
This measures how revenue changes from one quarter to the next for each region and category. LAG() retrieves the previous quarter’s value to compute absolute and percentage change.
WITH base AS (
SELECT dr.region_name, dc.category_name, dt.year, dt.quarter,
SUM(fs.revenue) AS revenue
FROM fact_sales fs
JOIN dim_region dr ON fs.region_id = dr.region_id
JOIN dim_time dt ON fs.time_id = dt.time_id
JOIN dim_product dp ON fs.product_id = dp.product_id
JOIN dim_subcategory ds ON dp.subcategory_id = ds.subcategory_id
JOIN dim_category dc ON ds.category_id = dc.category_id
GROUP BY dr.region_name, dc.category_name, dt.year, dt.quarter
)
SELECT region_name, category_name, year, quarter, revenue,
revenue – LAG(revenue) OVER (PARTITION BY region_name, category_name ORDER BY year, quarter) AS qoq_change,
CASE WHEN LAG(revenue) OVER (PARTITION BY region_name, category_name ORDER BY year, quarter) = 0
THEN NULL
ELSE ROUND(100.0 * (revenue – LAG(revenue) OVER (PARTITION BY region_name, category_name ORDER BY year, quarter)) /
NULLIF(LAG(revenue) OVER (PARTITION BY region_name, category_name ORDER BY year, quarter),0), 2)
END AS qoq_pct
FROM base
ORDER BY region_name, category_name, year, quarter;
Q6 – Year-to-Date (YTD) Running Total
This tracks cumulative revenue for each category within a year. SUM() OVER (…) adds up sales month by month to show how revenue accumulates.
WITH monthly AS (
SELECT dt.year, dt.month, dc.category_name,
SUM(fs.revenue) AS revenue
FROM fact_sales fs
JOIN dim_time dt ON fs.time_id = dt.time_id
JOIN dim_product dp ON fs.product_id = dp.product_id
JOIN dim_subcategory ds ON dp.subcategory_id = ds.subcategory_id
JOIN dim_category dc ON ds.category_id = dc.category_id
GROUP BY dt.year, dt.month, dc.category_name
)
SELECT year, month, category_name, revenue,
SUM(revenue) OVER (PARTITION BY year, category_name ORDER BY month
ROWS BETWEEN UNBOUNDED PRECEDING AND CURRENT ROW) AS ytd_revenue
FROM monthly
ORDER BY year, month, category_name;
Q7 – Category Market Share
This calculates how much each category contributes to total sales within each region and quarter, showing each category’s share as a percentage of regional revenue.
WITH base AS (
SELECT dr.region_name, dt.year, dt.quarter, dc.category_name,
SUM(fs.revenue) AS revenue
FROM fact_sales fs
JOIN dim_region dr ON fs.region_id = dr.region_id
JOIN dim_time dt ON fs.time_id = dt.time_id
JOIN dim_product dp ON fs.product_id = dp.product_id
JOIN dim_subcategory ds ON dp.subcategory_id = ds.subcategory_id
JOIN dim_category dc ON ds.category_id = dc.category_id
GROUP BY dr.region_name, dt.year, dt.quarter, dc.category_name
),
tot AS (
SELECT region_name, year, quarter, SUM(revenue) AS total_rev
FROM base
GROUP BY region_name, year, quarter
)
SELECT b.region_name, b.year, b.quarter, b.category_name, b.revenue,
ROUND(100.0 * b.revenue / t.total_rev, 2) AS pct_share
FROM base b
JOIN tot t USING (region_name, year, quarter)
ORDER BY b.region_name, b.year, b.quarter, b.category_name;
Q8 – Channel Mix per Quarter
For the year 2025, this query measures what percentage of sales came from each channel (Online, Store) within every quarter.
WITH q AS (
SELECT dt.quarter, ch.channel_name, SUM(fs.revenue) AS revenue
FROM fact_sales fs
JOIN dim_time dt ON fs.time_id = dt.time_id
JOIN dim_channel ch ON fs.channel_id = ch.channel_id
WHERE dt.year = 2025
GROUP BY dt.quarter, ch.channel_name
),
tot AS (
SELECT quarter, SUM(revenue) AS total_rev FROM q GROUP BY quarter
)
SELECT q.quarter, q.channel_name, q.revenue,
ROUND(100.0 * q.revenue / t.total_rev, 2) AS pct_in_quarter
FROM q JOIN tot t USING (quarter)
ORDER BY q.quarter, q.channel_name;
Q9 – Detect Revenue Declines
This identifies all region–category pairs that experienced at least one drop in revenue between consecutive quarters.
WITH series AS (
SELECT dr.region_name, dc.category_name, dt.year, dt.quarter,
SUM(fs.revenue) AS revenue
FROM fact_sales fs
JOIN dim_region dr ON fs.region_id = dr.region_id
JOIN dim_time dt ON fs.time_id = dt.time_id
JOIN dim_product dp ON fs.product_id = dp.product_id
JOIN dim_subcategory ds ON dp.subcategory_id = ds.subcategory_id
JOIN dim_category dc ON ds.category_id = dc.category_id
GROUP BY dr.region_name, dc.category_name, dt.year, dt.quarter
),
lagged AS (
SELECT *, LAG(revenue) OVER (PARTITION BY region_name, category_name ORDER BY year, quarter) AS prev_rev
FROM series
)
SELECT DISTINCT region_name, category_name
FROM lagged
WHERE prev_rev IS NOT NULL AND revenue < prev_rev
ORDER BY region_name, category_name;
Q10 – Filtered Rollup
This variation of ROLLUP filters results to show only groups with total revenue greater than 200. COALESCE replaces NULLtotals with zero for safe comparison.
SELECT dt.year, dc.category_name, SUM(fs.revenue) AS revenue
FROM fact_sales fs
JOIN dim_time dt ON fs.time_id = dt.time_id
JOIN dim_product dp ON fs.product_id = dp.product_id
JOIN dim_subcategory ds ON dp.subcategory_id = ds.subcategory_id
JOIN dim_category dc ON ds.category_id = dc.category_id
GROUP BY ROLLUP (dt.year, dc.category_name)
HAVING COALESCE(SUM(fs.revenue),0) > 200
ORDER BY dt.year NULLS LAST, dc.category_name NULLS LAST;