Objective
Learn how to explore networks represented by graphs using 5 well known graph operations that you should know. Therefore, the exercise uses a facebook network data set.
Material
- Kaggle account
- Python notebook
- Facebook_Social_Network dataset available in Kaggle: https://www.kaggle.com/roshansharma/facebook-social-network
ToDo
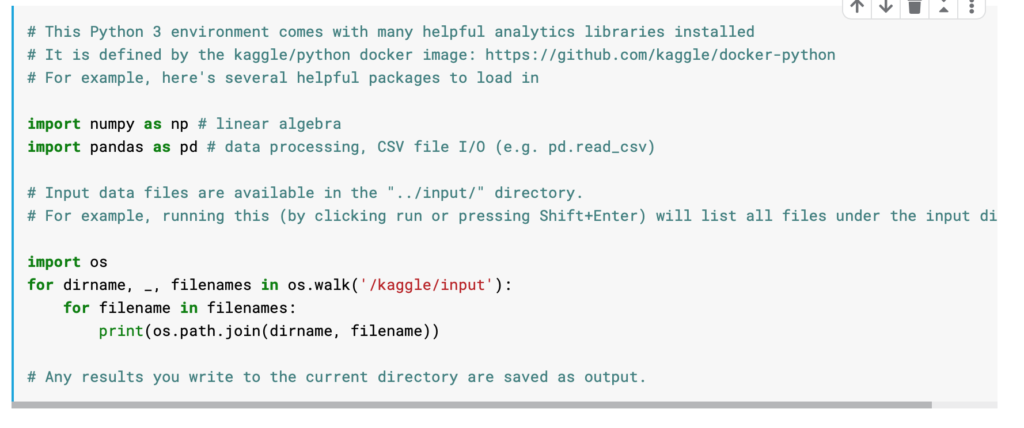
1 Upload the data set searching on the Kaggle Datasets Explorer and add it to your Notebook running environment
2 Locate the uploaded dataset as follows:

3. First we are going to have a first approximation to the libraries dealing with networks in Python. Therefore we import the corresponding libraries networkx for the corresponding data structure and associated operations and plotly for generating graphics.

First we create a network linking cities with their distance.
edgelist = [['Mannheim', 'Frankfurt', 85],

            ['Mannheim', 'Karlsruhe', 80],

            ['Erfurt', 'Wurzburg', 186],

            ['Munchen', 'Numberg', 167],

            ['Munchen', 'Augsburg', 84],

            ['Munchen', 'Kassel', 502],

            ['Numberg', 'Stuttgart', 183],

            ['Numberg', 'Wurzburg', 103],

            ['Numberg', 'Munchen', 167],

            ['Stuttgart', 'Numberg', 183],

            ['Augsburg', 'Munchen', 84],

            ['Augsburg', 'Karlsruhe', 250],

            ['Kassel', 'Munchen', 502],

            ['Kassel', 'Frankfurt', 173],

            ['Frankfurt', 'Mannheim', 85],

            ['Frankfurt', 'Wurzburg', 217],

            ['Frankfurt', 'Kassel', 173],

            ['Wurzburg', 'Numberg', 103],

            ['Wurzburg', 'Erfurt', 186],

            ['Wurzburg', 'Frankfurt', 217],

            ['Karlsruhe', 'Mannheim', 80],

            ['Karlsruhe', 'Augsburg', 250],

            ["Mumbai", "Delhi",400],

            ["Delhi", "Kolkata",500],

            ["Kolkata", "Bangalore",600],

            ["TX", "NY",1200],

            ["ALB", "NY",800]]
We create a graph with the previous data.
g = nx.Graph()

for edge in edgelist: g.add_edge(edge[0],edge[1], weight = edge[2])
Question 1: Find out distinct continents and their cities from this graph.
for i, x in enumerate(nx.connected_components(g)): print("cc"+str(i)+":",x)
Question 2: Find the shortest path between Stuttgart and Frankfurt and its length.
print(nx.shortest_path(g, 'Stuttgart','Frankfurt',weight='weight'))

print(nx.shortest_path_length(g, 'Stuttgart','Frankfurt',weight='weight'))
Question 3: Find the shortest path among the cities of the graph.
for x in nx.all_pairs_dijkstra_path(g,weight='weight'): print(x)
Minimum spannig tree
Question 4: We need to connect all the cities in the graph we have using the minimum amount of wire/pipe. How do we do this?
#nx.minimum_spanning_tree(g) returns a instance of type nx.minimum_spanning_tree(g) returns a instance of type graph
graphnx.draw_networkx(nx.minimum_spanning_tree(g))
PAGE RANK
It assigns scores to pages based on the number and quality of incoming and outgoing links. Pagerank can be used anywhere where we want to estimate node importance in any network.
Create Link between user if user A follows user B and Link between user and Tweets if user tweets/retweets a tweet.
For this we are finally going to retrieve the Facebook Network data collection (!)
fb = nx.read_edgelist('/kaggle/input/facebook-social-network/facebook-combined.txt', create_using = nx.Graph(), nodetype = int)
.. and let us plot the network to see how does it look like:
pos = nx.spring_layout(fb)
import warnings
warnings.filterwarnings('ignore')
warnings.simplefilter('ignore')
import matplotlib.pyplot as plt

plt.style.use('fivethirtyeight')
plt.rcParams['figure.figsize'] = (20, 15)
plt.axis('off')

nx.draw_networkx(fb, pos, with_labels = False, node_size = 35)
plt.show()
Let us compute the page rank for all the nodes.
pageranks = nx.pagerank(fb)

print(pageranks)
Let us now order the page rank results
import operator

sorted_pagerank = sorted(pageranks.items(),

key=operator.itemgetter(1),reverse = True)

print(sorted_pagerank)
Question 5: Create a subgraph with more influential users.
first_degree_connected_nodes = list(fb.neighbors(3437))
second_degree_connected_nodes = []
for x in first_degree_connected_nodes:

    second_degree_connected_nodes+=list(fb.neighbors(x))

second_degree_connected_nodes.remove(3437)
second_degree_connected_nodes = list(set(second_degree_connected_nodes))

subgraph_3437 = nx.subgraph(fb, first_degree_connected_nodes + second_degree_connected_nodes)

pos = nx.spring_layout(subgraph_3437)
And we visualise the most influential users painting them in yellow :
import matplotlib.pyplot as plt

node_color = ['yellow' if v == 3437 else 'red' for v in subgraph_3437]

node_size = [1000 if v == 3437 else 35 for v in subgraph_3437]

plt.style.use('fivethirtyeight')

plt.rcParams['figure.figsize'] = (20, 15)

plt.axis('off')

nx.draw_networkx(subgraph_3437, pos, with_labels = False, node_color=node_color,node_size=node_size )

plt.show()
Centrality measures
Betweenness centrality quanties how many times a particular node
comes in the shortest chosen path between two other nodes.
Degree Centrality: It is simply the number of connections for a node.
Here is the code for finding the Betweenness centrality for the subgraph.
pos = nx.spring_layout(subgraph_3437)

betweennessCentrality = nx.betweenness_centrality(subgraph_3437,normalized=True, endpoints=True)

node_size = [v * 10000 for v in betweennessCentrality.values()]

plt.figure(figsize=(20,20))

nx.draw_networkx(subgraph_3437, pos=pos, with_labels=False, node_size=node_size )

plt.axis('off')
This notebook has been proposed by https://towardsdatascience.com/data-scientists-the-five-graph-algorithms-that-you-should-know-30f454fa5513